
Organic click-through rate (CTR) used to behave like a clean, predictable curve: rank higher → get more clicks. In 2026, the curve still exists, but it’s increasingly “bent” by how Google builds the page around you—especially with AI Overviews (and early AI-first SERP experiences).
The core problem: ranking positions are no longer the only “positions” that matter. A #1 blue link can be visually displaced by AI Overviews, featured snippets, local packs, “People Also Ask,” video/image blocks, shopping units, and more. That changes user attention, scrolling patterns, and the share of searches that end with no click at all.
This guide gives you:
- A 2026 baseline CTR-by-position curve (positions 1–10)
- A cross-check against other large CTR studies (so you can see ranges, not just one table)
- A practical explanation of how AI Overviews are pressuring CTR in 2026
- Specific tactics to keep winning clicks (and also win AI citations when clicks shrink)
1) What “Organic CTR by Position” actually means in 2026
Organic CTR is:
Clicks ÷ impressions for an organic listing (usually measured in Google Search Console).
When people say “CTR by position,” they often want a universal chart like:
- Position 1 = X%
- Position 2 = Y%
- …
- Position 10 = Z%
But in 2026, the “universal chart” idea is weaker than ever, because CTR is heavily influenced by:
- Intent (informational vs navigational vs transactional)
- Device (desktop vs mobile layouts and scroll depth)
- SERP features (local pack, PAA, shopping, videos, images, knowledge panels)
- Brand bias (brand queries can massively inflate CTR for the brand)
- AI Overviews / AI-first SERPs (answers shown directly on Google)
So when you use any CTR-by-position statistic, treat it as a baseline, then adjust based on what the SERP looks like for your query set.
2) The baseline: Organic CTR by ranking position (2026)
A widely cited 2026 benchmark comes from First Page Sage’s CTR meta-analysis, which consolidates multiple sources into a unified set of CTR numbers. Their “CTR by position” table is framed as applying to Google Search pages with no other elements (no maps, images, videos, shopping, etc.). That “clean SERP” assumption matters a lot in 2026. [1]
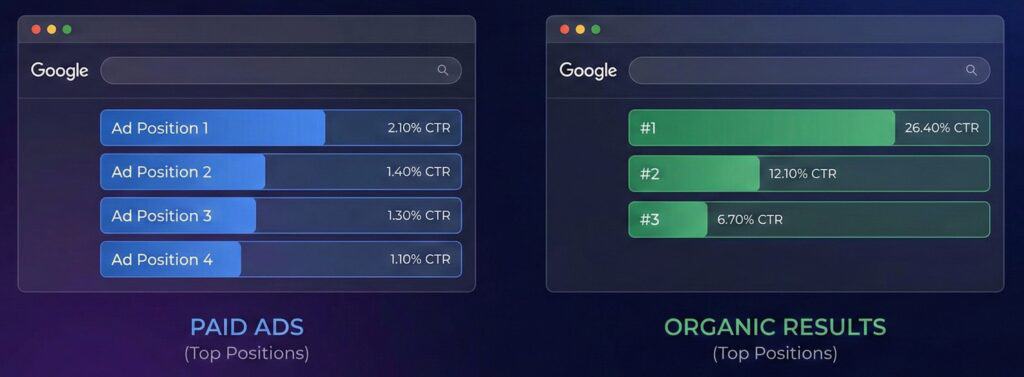
2026 CTR table
| Google Rank | CTR (2026) |
| Ad Position 1 | 2.10% |
| Ad Position 2 | 1.40% |
| Ad Position 3 | 1.30% |
| Ad Position 4 | 1.10% |
| #1 | 26.40% |
| #2 | 12.10% |
| #3 | 6.70% |
| #4 | 4.80% |
| #5 | 3.40% |
| #6 | 2.90% |
| #7 | 2.00% |
| #8 | 1.40% |
| #9 | 1.20% |
| #10 | 1.00% |
How to use this table (correctly):
- It’s great for quick forecasting when a SERP is mostly classic organic links.
- It’s less reliable for SERPs with heavy modules (local pack, shopping, video) or AI Overviews.
First Page Sage also highlights how the CTR curve changes when major SERP modules are present (example: when a local pack appears, the CTR for the classic organic #1 can drop substantially). [1]
3) Cross-checking the curve: why other studies show lower (or different) CTR
To avoid treating a single benchmark as “the truth,” compare it against independent CTR datasets that explicitly measure SERP features and device effects.
A commonly referenced large CTR study from SISTRIX shows that CTR is highly sensitive to SERP composition. Their results include “purely organic” mobile SERPs as well as SERPs with sitelinks, featured snippets, etc. [2]
Examples from the SISTRIX CTR study:
- “Purely organic” (mobile): Position #1 average CTR around 34.2%, #2 around 17.1%, #3 around 11.4% [2]
- “Average” across result types: Position #1 around 28.5%, #2 15.7%, #3 11.0% [2]
- With sitelinks, position #1 CTR can jump (SISTRIX reports 46.9%) [2]
- With a featured snippet, the “classic organic” CTR patterns shift (SISTRIX reports #1 at 23.3% in that specific scenario set) [2]
A practical planning range (instead of a single “magic CTR”)
If you’re forecasting organic traffic in 2026 and want to be realistic:
- Position #1: often ~34%–40% depending on SERP cleanliness and intent [1][2]
- Position #2: ~17%–19% [1][2]
- Position #3: ~10%–11% [1][2]
Then, once you add SERP features (or AI Overviews), treat those ranges as the upper bound for many informational queries.
4) CTR by SERP feature: “position” isn’t enough anymore
In 2026, ranking #1 does not guarantee you are the top attention unit on the page.
First Page Sage provides example CTRs for major SERP elements, including:
- Featured snippet (top result style): 42.9% (for the snippet occupying the top area) [1]
- AI Overview (top): 38.9% (as reported in their element table) [1]
- People Also Ask: 3.0% [1]
- Knowledge panel: 1.4% [1]
These numbers are not “your guaranteed CTR.” They’re benchmarks that reinforce the key 2026 reality:
Google increasingly allocates click share to modules—not just “the ten blue links.”
5) The 2026 disruptor: AI Overviews and the “CTR squeeze”
If you want the honest 2026 story in one line:
AI Overviews reduce the need to click, and they concentrate the clicks that remain.
Google’s own explanation of AI Overviews is that they help users “get the gist” quickly and then use links as “jumping off points,” and that they can show up when the system thinks an AI summary is helpful. [3] Google also describes techniques like expanding queries (“query fan-out”) to gather supporting information and citations. [3]
5.1 AI Overviews are widespread (and growing)
Multiple data sources show AI Overviews appearing frequently—especially for informational queries.
For example, seoClarity reported AI Overviews appearing for roughly ~30% of U.S. desktop keywords in a late-2025 snapshot, alongside large growth in visibility over time (and strong skew toward informational intent). [4]
Google’s own announcements reinforce the trajectory:
- May 2024: Google announced AI Overviews rollout in the U.S., framing it as a major search experience shift. [5]
- Oct 2024: Google announced expansion to 100+ countries, stating AI Overviews reach 1B+ monthly users and discussing more prominent links/citations. [6]
Whether you love or hate AI Overviews, the direction is clear: more AI answers on more SERPs.
6) “AI Overviews are destroying CTR”: what the data actually shows
It’s easy to hand-wave this as “traffic is down.” But several large datasets have put real numbers on the trend.
6.1 BrightEdge: impressions up, CTR down ~30%
BrightEdge reported that since AI Overviews launched:
- Impressions increased substantially (reported at +49%)
- CTR dropped significantly (reported at around -30%) [7]
This matches what many SEOs see in Search Console: more exposure, fewer clicks.
6.2 Seer Interactive: organic CTR drops sharply on AIO queries
Seer Interactive published analysis across millions of impressions and a large keyword set, showing that when AI Overviews appear, organic CTR tends to fall.
Their reporting includes the often-cited shift:
- Organic CTR falling from roughly 1.41% to 0.64% on queries with AI Overviews in their tracked set [8]
In their later updates, Seer also shows that outcomes differ depending on whether you’re cited in the AI Overview or not (with cited sites seeing better CTR than non-cited sites, though still generally pressured compared to classic SERPs). [9]
The practical implication:
- Ranking alone may not rescue CTR on informational queries if the SERP is AI-heavy.
- Visibility inside the AI Overview citation set becomes a new “position.”
6.3 Zero-click behavior is rising (a symptom consistent with AI answers)
In a publishing-focused context (news), third-party analyses have also highlighted growing “zero-click” behavior and traffic declines that align with AI-driven SERP changes.
For example:
- TechCrunch, citing Similarweb analysis, reported zero-click news searches increasing from 56% to 69% year-over-year. [10]
- Similarweb’s publisher-focused reporting also cited a 26% decline in organic traffic to news sites since the launch of AI Overviews. [11]
News is a special case (high informational intent), but it’s also the clearest public example of how AI answers can suppress clicks at ecosystem scale.
7) The “two-curve” model for CTR by position in 2026
If you’re doing forecasting or performance reporting, one CTR curve is no longer enough. You need two models:
Curve A: Classic CTR-by-position (clean SERPs)
Use the baseline table (like the 39.8% / 18.7% / 10.2% pattern) for:
- Branded or navigational queries
- Transactional queries without heavy SERP modules
- SERPs where AI Overviews don’t typically trigger [1]
Curve B: AI / Feature-heavy CTR (informational SERPs)
Expect:
- More impressions
- Lower CTR (because the query gets answered on-SERP) [7][8]
- A bigger performance difference depending on whether you’re cited in the AI Overview [9]
This is why many sites report: rankings stable, impressions up, clicks down—it’s not a contradiction; it’s the new SERP.
8) Local SERPs: CTR behaves differently (and often remains strong)
If you’re doing local SEO, treat local pack CTR as its own category rather than mixing it into “position 1–10” organic curves.
First Page Sage reports average CTRs for local packs:
- Local pack #1: 17.6%
- Local pack #2: 15.4%
- Local pack #3: 15.1% [1]
They also note that when a local pack is present, traditional organic CTR can drop (because the pack dominates attention). [1]
9) How to protect (and grow) organic clicks in 2026
When clicks get harder to win, the play is not simply “rank higher.” It’s:
- Win the click when clicks exist, and
- Win the AI citation when clicks are being siphoned.
9.1 Optimize for AI citations (not just rankings)
Google frames AI Overviews as providing citations and links to support exploration. [3]
Seer’s analysis suggests being cited correlates with better CTR outcomes than being excluded (even if overall CTR is still pressured compared to classic SERPs). [9]
Practical content patterns that often help (because they’re easy to extract and cite):
- Clear, definition-first sections (“What is X?” in 40–70 words)
- Tight subsections that answer a single sub-question (clean H2/H3 structure)
- Tables that summarize comparisons or steps
- Evidence: quotes, references, dates, measurements, screenshots
- Consistent entity language (don’t use five names for the same concept)
9.2 Make your snippet “obviously worth clicking”
AI Overviews are strongest at summarizing generic explanations. You win clicks when your result promises something the AI summary won’t deliver:
- A template, script, checklist, calculator
- A step-by-step SOP with screenshots
- Updated numbers (with dates)
- A tool or dataset
- A nuanced answer for a specific audience (“for plumbers,” “for Shopify,” “for enterprise,” etc.)
This is especially important if the AI Overview already answers the basics. Your listing must communicate what’s next.
9.3 Shift KPI expectations: impressions ≠ traffic
BrightEdge’s “impressions up / CTR down” pattern is a reminder that old KPI stacks can mislead in 2026. [7]
If AI Overviews are present in your space, consider adding:
- Share of queries where you are cited in AI Overviews
- Brand search lift (AI visibility can increase later branded clicks)
- Conversion rate and revenue per click (optimize the smaller traffic pool harder)
- Diversification metrics (email, community, YouTube, direct)
9.4 Build assets that AI can’t fully replace
If a SERP is becoming answer-first, your content needs defensibility:
- Proprietary data
- Fresh experiments and screenshots
- Tools and calculators
- Real-world case studies with measurable outcomes
- Opinionated, experience-based recommendations (where appropriate)
10) A note on where this is headed: AI-first SERPs
Finally, don’t ignore the direction of travel. Reuters reported Google testing an “AI Mode” experience that shifts the SERP toward an AI summary with follow-ups instead of a classic list of links. [12]
Even if AI Mode isn’t the default for most users, it signals what Google is willing to do: turn more searches into an in-SERP conversation. From a CTR standpoint, that’s a continuation of the same trend line: fewer clicks, more on-platform satisfaction.
Conclusion
If you only remember one thing:
In 2026, “organic CTR by position” is no longer a single curve—it’s a curve that changes depending on whether Google shows AI Overviews and which SERP features are present.
Use classic CTR-by-position benchmarks as a baseline. [1][2]
Then adjust based on the SERP reality of your keyword set—especially AI Overviews, which multiple datasets associate with meaningful CTR declines. [7][8][9]
The winners in 2026 are the ones who do both:
- Rank
- Get selected (cited, surfaced, and trusted inside AI-driven result modules)
References (all citations)
[1] First Page Sage — “Google Click-Through Rates (CTRs) by Ranking Position in 2026” (report page; last updated May 28, 2025).
[2] SISTRIX — CTR study/results page showing CTR differences by SERP type (pure organic, sitelinks, featured snippets, etc.).
[3] Google Search Central — Documentation explaining AI Overviews and how they relate to websites/links and search behavior.
[4] seoClarity — Research page/report describing AI Overview prevalence (e.g., share of keywords showing AIO, growth trends, intent skew).
[5] Google (The Keyword blog) — May 2024 announcement about AI Overviews rollout in Google Search.
[6] Google (The Keyword blog) — Oct 2024 announcement expanding AI Overviews to 100+ countries and noting 1B+ monthly users and link/citation visibility changes.
[7] BrightEdge — May 2025 reporting on AI Overviews era metrics, including impressions up and CTR down (~30%).
[8] Seer Interactive — Research post reporting organic CTR decline on queries with AI Overviews (e.g., ~1.41% → ~0.64% in tracked set).
[9] Seer Interactive — Follow-up/update showing CTR differences when a brand/site is cited vs not cited in AI Overviews (with example CTR values).
[10] TechCrunch — Article citing Similarweb analysis about increase in zero-click news searches (56% → 69%).
[11] Similarweb — Publisher/news ecosystem reporting noting organic traffic declines since AI Overviews (e.g., 26% figure cited in publisher-focused reporting).
[12] Reuters — Reporting on Google testing “AI Mode” / AI-first SERP experience that reduces traditional link lists in favor of AI summaries and follow-ups.
