Google values page speed as one of the essential aspects of your page ranking. Additionally, users see page speed as one of the deciding factors on whether to stay on your site. Website performance ranking involves several metrics, and FCP is one of the vital metrics Google considers when assessing a website’s overall performance score. But what is First Contentful Paint?
A site’s FCP aims to measure page load speed from the user’s perspective. Therefore, by optimizing your website’s FCP, you not only improve load times and increase page speed ratings, but you also show your visitors that the loading hasn’t stalled and their requests are being handled.
FCP is part of Google’s Core Web Vitals, playing an essential role in improving the user experience for visitors. This means it influences Google’s SERP rankings when incorporated into Google’s search algorithm. As a result, it is important for SEO specialists and website owners to understand how to achieve an excellent First Contentful Paint score.
In this article, we’ll go in-depth on what First Contentful Paint is and how to measure and optimize it, so you can be sure that your website performs as efficiently as possible.
What is First Contentful Paint?
FCP (First Contentful Paint) is one of the Core Web Vitals that measure the time it takes for the browser to render the first DOM (document object model) element. This includes text, images, non-white (canvas), or SVG elements. This metric is crucial for providing quick user experiences, hence minimizing SEO performance penalties.
Typically, FCP measures how long it takes for the user to see the first element on your web page. Therefore, since the FCP is the first thing users see when the webpage loads, achieving a fast FCP is essential for making a positive first impression. It signals the user that their requested information is being served. This limits the likelihood of the user leaving your website.
FCP should be low to enable users to see the website’s elements rendering quickly after loading the page in the user’s browser. Users will spend more time on your website if your FCP score is better. And because of this, your users will have a better website experience and won’t leave your site in frustration because the page is not loading correctly.
Note that the FCP element may not be the first thing loaded from the server but the first thing the user can see. Therefore, it’s paramount to a website’s UX (user experience) since it measures how users perceive the page load. Also, FCP doesn’t account for anything your site contains within an iframe and the non-content painting, like a change in the background color.
How To Measure the First Contentful Paint
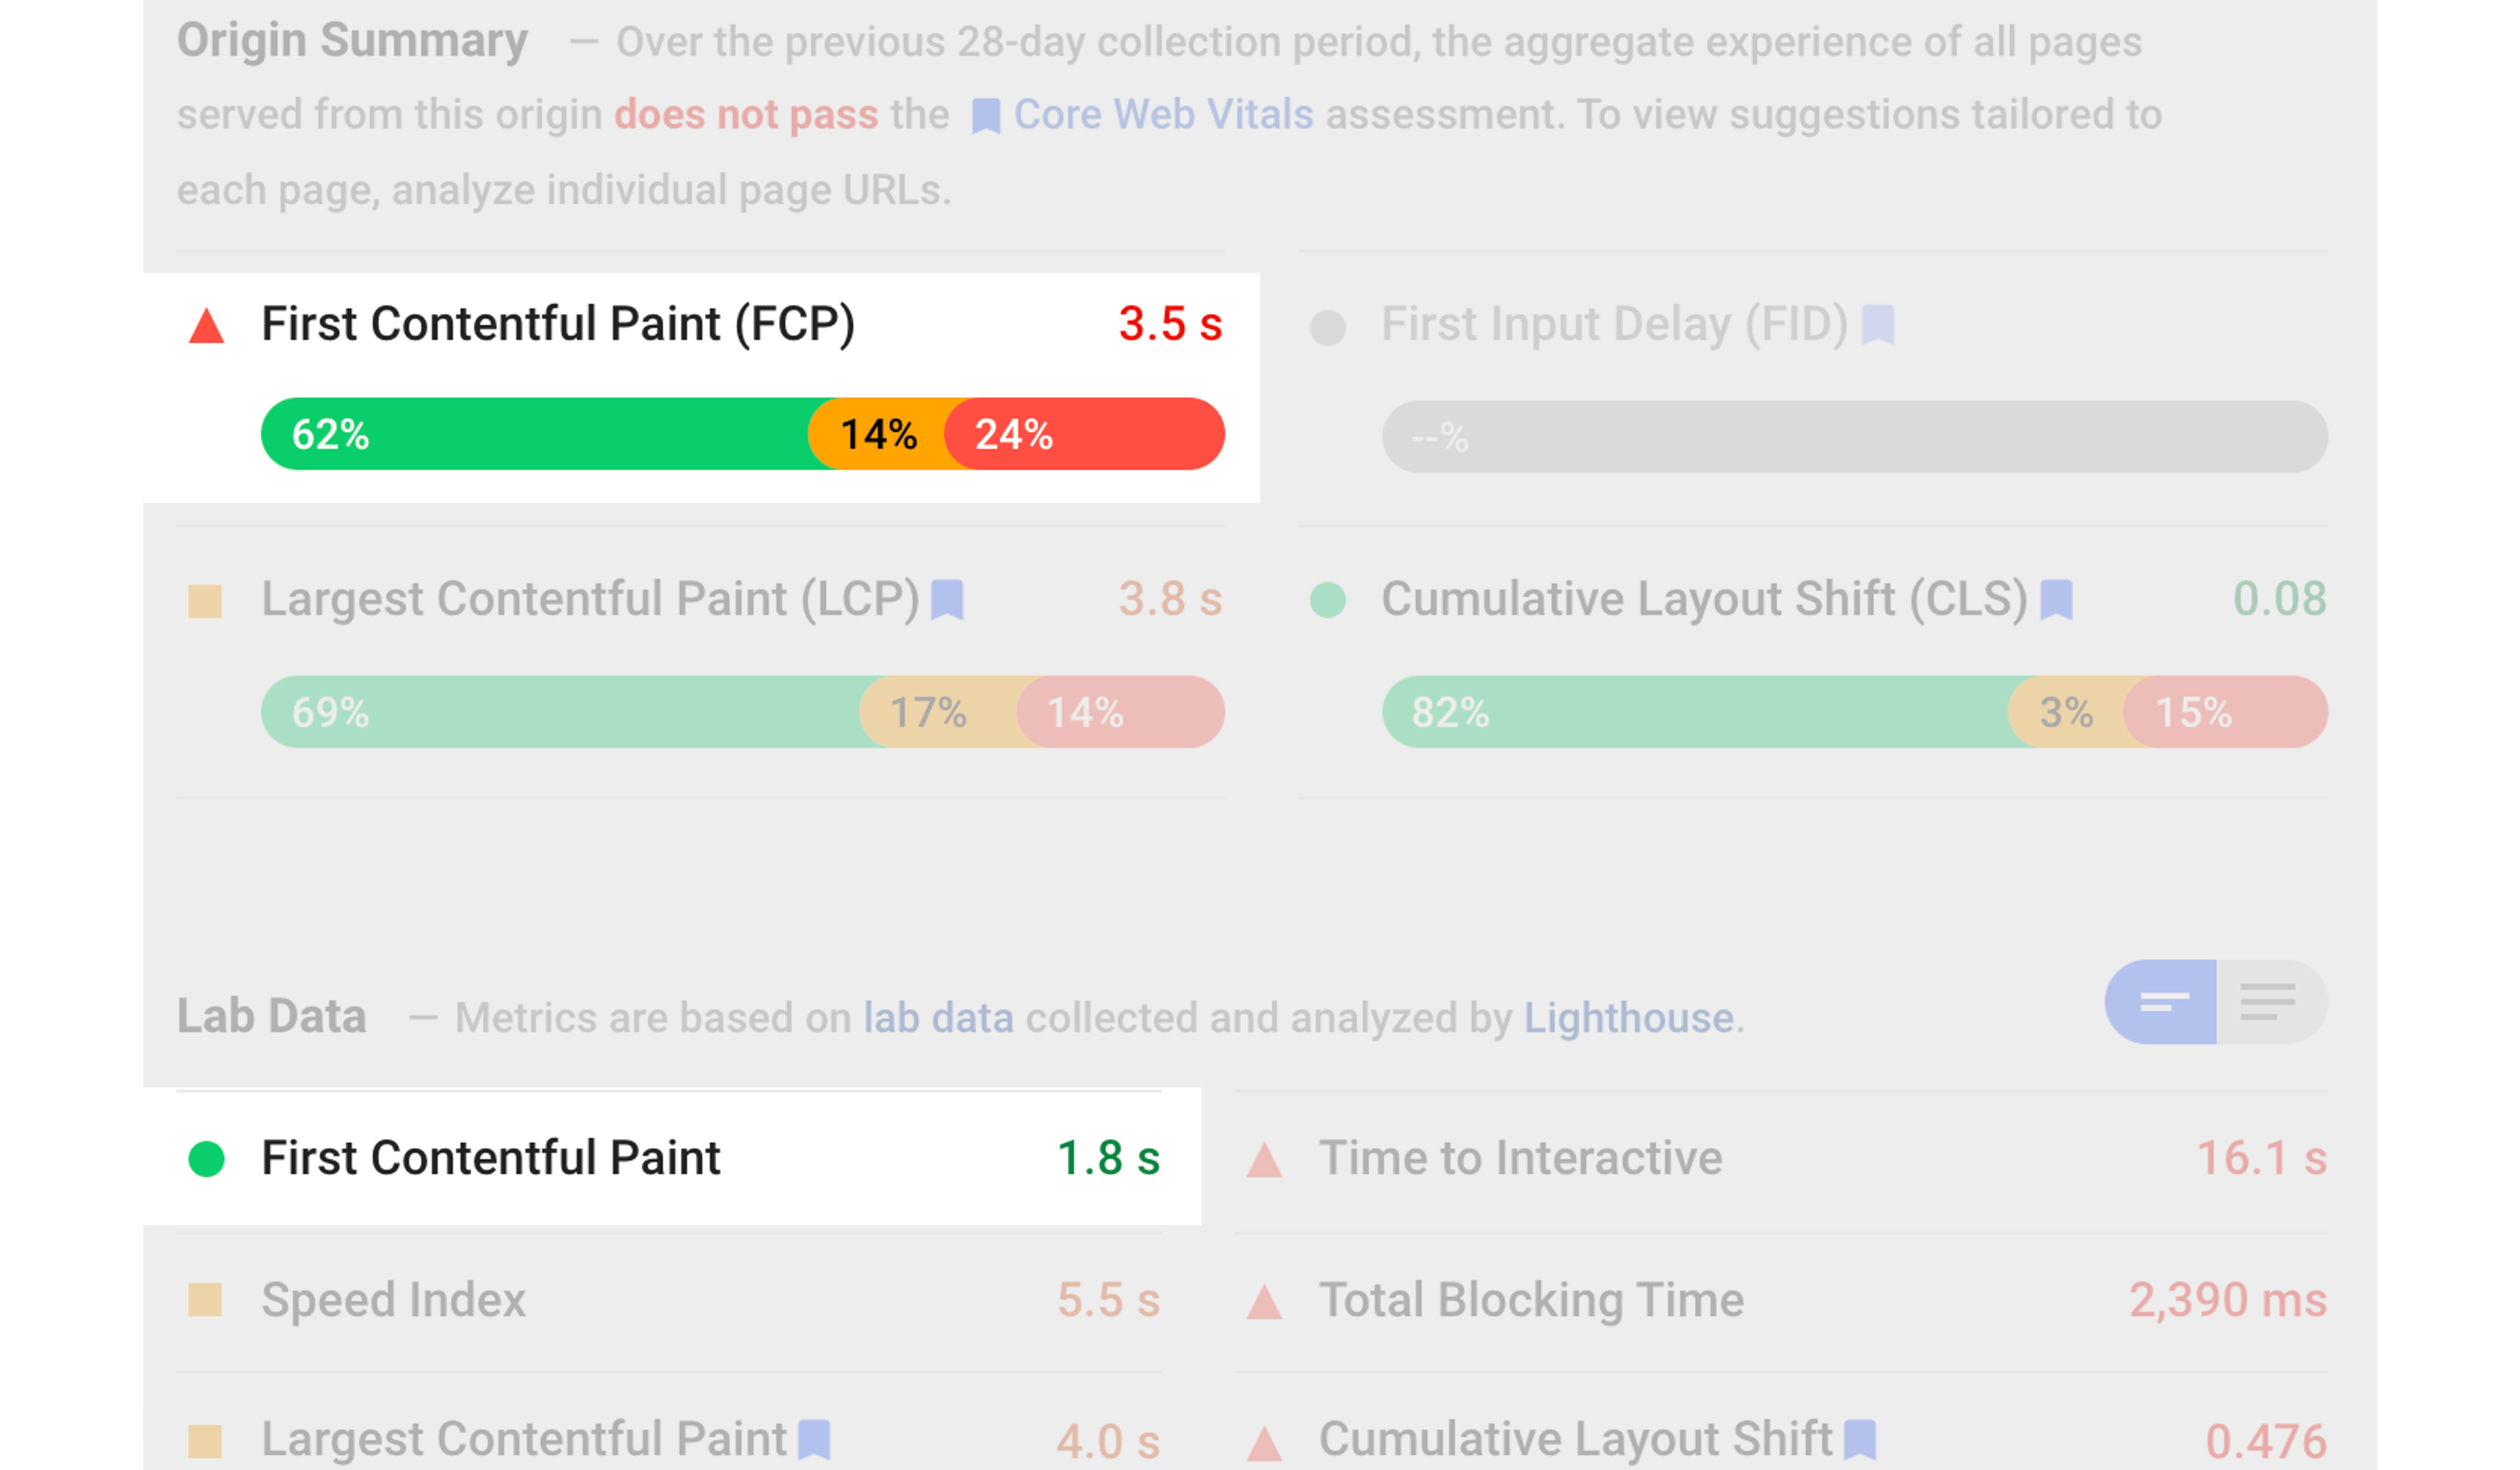
Image Source: connectionmodel.com
FCP can be measured in the field (real-world users) and the lab (pre-release).
While testing FCP in the lab is a good way to solve issues before your website goes live, it is not the most accurate way to assess performance. That is where field testing comes in, showing you how users interact with your website on different devices, user interactions, and network connections.
Here are the tools to measure FCP
Lab Tools
- Lighthouse
- Chrome DevTools
- PageSpeed Insights
Field Tools
- PageSpeed Insights
- Chrome User Experience Report
- Search Console (Speed Report)
- Web-vitals JavaScript library
What Is a Good FCP Score?
It is important to understand what a good FCP score is before assessing your website’s FCP. Since FCP measures how long your page’s first element takes to render and be visible on the screen, the lower the score, the better.
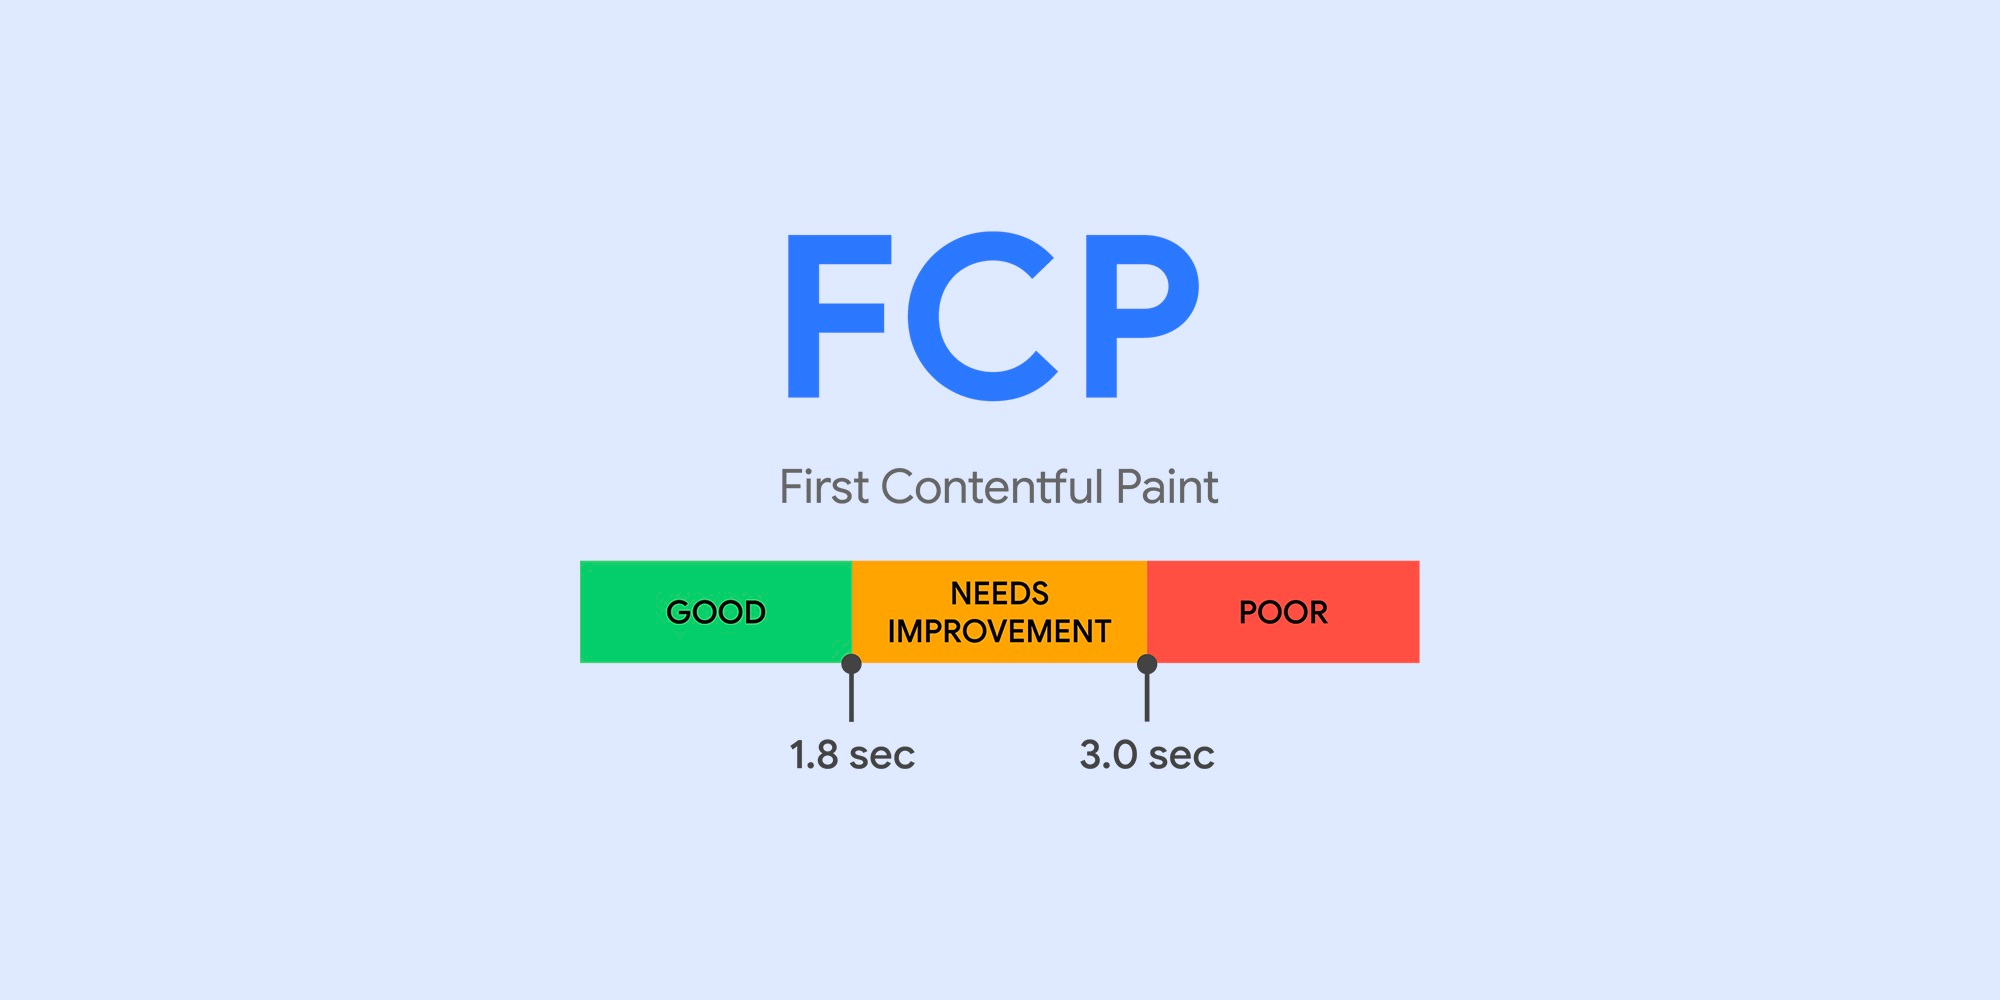
Image Source: webasmek.com.tr
Google recommends aiming for an FCP score of 1.8 seconds or less. You’ll be able to see if your website requires improvement if you have a better idea of what your site’s FCP speeds should be. To ensure you are hitting this target for most users, an excellent threshold to measure is the 75th percentile of page loads, segmented across desktop and mobile devices.
You should follow the Google thresholds to understand your FCP score better. Also, each FCP threshold is marked with a different color, making it easier to interpret the score.
Here are the thresholds specified for FCP values:
- Between 0 to 1.8 seconds- Good (Green)
- Between 1.8 to 3.0 seconds- Needs improvement (Orange)
- Over 3.0 seconds- Poor (Red)
How Does FCP Affect a Website’s Overall Performance?
FCP is a user-centric perception metric that doesn’t necessarily indicate a site’s performance. For instance, two websites might have the same loading time, but the site with a lower FCP time might be perceived as being faster. This perception can affect user experience and even overall website performance.
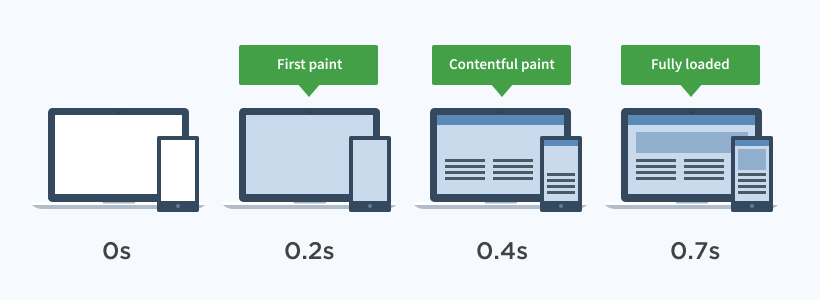
Image Source: raygun.com
However, FCP is a great metric to follow in order to take the overall website performance to a higher level. Any actions you take to lower FCP can also lower your page speed. Therefore, you can take it as a signal of your overall performance.
Generally, a low FCP time will not coincide with a high overall load time. Therefore, if you need a single metric to see where you stand, FCP can be a good guideline. Also, you can pair it with LCP (Largest Contentful Paint) to get a more complete view of what your visitors see in the first seconds of coming to your site.
What Causes Poor FCP Score
- Slow font load time
- Slow server response time (TTFB)
- Multiple page redirects
- Render-blocking resources
- Unused or inefficient CSS
- Script-based elements above the fold
- Lazy loading above the fold
- Not inlining images above the fold
- Excessive DOM size
How to Improve FCP
1. Eliminate Render Blocking Resources
This is one of the on-page factors for lowering your FCP time. Render-blocking resources are files on your site that your webpage should have to render. These include JavaScript, HTML, fonts, and CSS files.
They’re “render blocking” because the browser prioritizes them over anything else on the page, stopping the loading process of anything else until they finish. Any plain text, images, or other user-facing content is suspended until the vital files are finished.
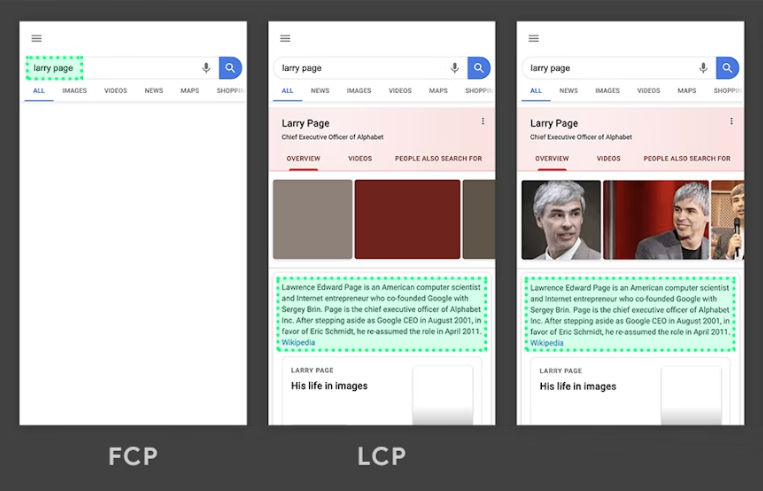
Image Source: onlinemediamasters.com
This delay causes an increase in FCP because:
- Render-blocking files are normally large in size.
- Render-blocking resources don’t typically contain site content, only formatting and structure.
Therefore, you should aim to reduce or remove the render-blocking resources. You can do this in several ways, including:
a) Inline Critical Resources
FCP can be increased by inlining critical resources. First, you should identify your website’s critical styles and scripts. For instance, when a page loads, the user might see the FOUC (flash of unstyled content) that can distract the user. To avoid FOUC and improve the FCP time, you should identify the minimum CSS used on the first part of the page the user sees when visiting your website.
To remove the critical scripts from the render-blocking resource, you can generate a Critical Path CSS and then inline them inside the HTML page with <style> and <script> tags. Doing this ensures your webpage has everything needed to handle its functionality when it loads.
b) Remove Anything Unused
When identifying critical resources on your webpage, you may find code that isn’t being used. Removing unused code, such as unused JavaScript, will also help you optimize your webpage.
If you are uncomfortable handling code, tools such as WP Rocket give you the easiest way to defer non-critical JavaScript files with only a few clicks. Also, you can optimize CSS delivery with WP Rocket to remove render-blocking stylesheets.
c) Defer Non-Critical Resources
You should mark the URLs with defer or async attributes for non-critical resources.
Adding the defer attribute to the URLs of non-critical scripts will direct the browser to execute the script file after the HTML document is completely parsed.
For non-critical stylesheets, it’s recommended that you add an asyncattribute to their URL. This directs the browser to load the scripts asynchronously while the rest of the page elements continue loading uninterrupted.
2. Reduce Server Response Times (TTFB)
Server response time, or time to first bite (TTFB), is the time a browser takes to receive the first byte of page content. When you try to access a website, the request is sent to the server over the internet; then, the server processes the request and returns the requested data. Therefore, TTFB is the sum of all the time it takes to return the first byte to the user system.
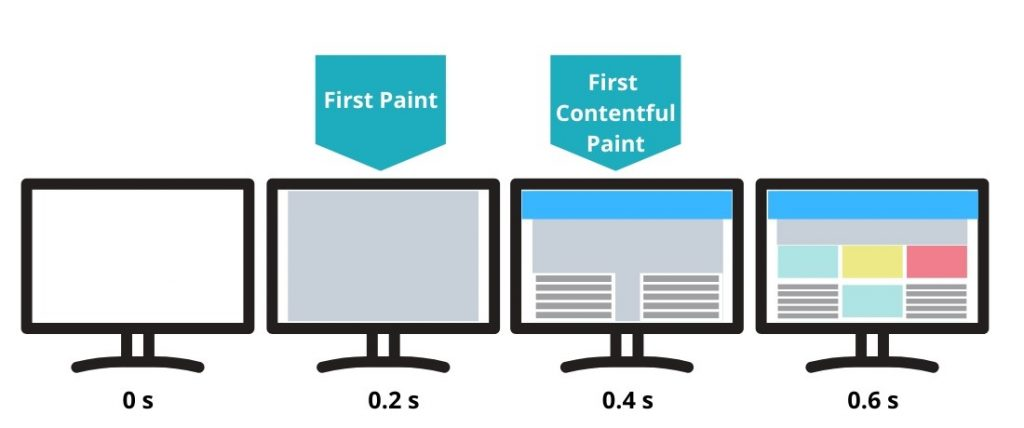
Image Source: wedevs.com
TTFB = HTTP Request + Request Processing time + HTTP Response
If you can reduce any of these parameters, your TTFB will reduce and eventually increase the FCP. Even though FCP depends on multiple other parameters, increasing server response time will majorly affect the performance. There are several ways to TTFB in WordPress;
a) Choose a Fast Hosting Provider
You need to choose a great web hosting solution. Preferably, you should choose a host with servers that are located close to your users.
b) Use a Quality CDN
A quality CDN helps speed up a site’s delivery of static resources like videos, images, and scripts, significantly reducing the network latency between your users and your server.
c) Enable Caching for Your Website
Caching reduces TTFB by decreasing the server’s processing time. Most WordPress hosting providers have enabled server-level caching, so check with your provider to see what they offer.
3. Keep Your DOM Size Small
More often, one of the main limiting factors of having a quick FCP is having a big Document Object Model (DOM). The DOM is a representation of all the objects that make up a webpage, graphically represented as a tree with branching objects and nodes. Many people overcomplicate their site’s landing pages and home pages in an attempt to impress visitors. However, these added elements bloat the DOM, causing a higher FCP time.
A big DOM makes reading and comprehending a webpage difficult for a browser. It harms website performance and increases the page load timeline. Therefore, it is best to have a small DOM that makes it easier for the browser to read.
Having a big DOM tree can negatively impact your FCP due to many reasons:
- A big DOM tree includes many nodes that are not visible to the user during the initial stages of page load.
- A big DOM size means more loading time is required to style and compute all the nodes, which can slow down rendering.
- A big DOM tree can overwhelm the memory performance of the user’s devices.
How to Reduce DOM Size
You only need to create DOM nodes when needed and destroy those not needed. However, this tip does not apply to most WordPress sites since creating the DOM is usually handled by themes, plugins, page builders, and the WordPress core itself.
Here are several ways to reduce DOM size:
- Paginate comments, posts, products, etc.
- Split up large pages into smaller ones.
- Choose well-optimized themes.
- Enable lazy loading for many HTML elements, not just images.
- Avoid using bloated page builders that insert needless <div> tags.
- Reduce the number of posts shown on your homepage and archive pages.
- Remove unwanted content using CSS. Don’t hide it.
- Do not use plugins that add too many <div> tags (e.g., Mega menu plugins).
To reduce your WordPress DOM size:
- Avoid using page plugins or builders that insert needless <div> tags—for example, Elementor and Mega menus.
- Choose a well-optimized theme like Astra.
4. Avoid Multiple-Page Redirects
When a user requests a resource that has been redirected, the server usually returns an HTTP 301 status code response. This redirect response forces the user to make another HTTP request to the new location, delaying the loading of the resource. This slows down the website giving the user a bad page experience.
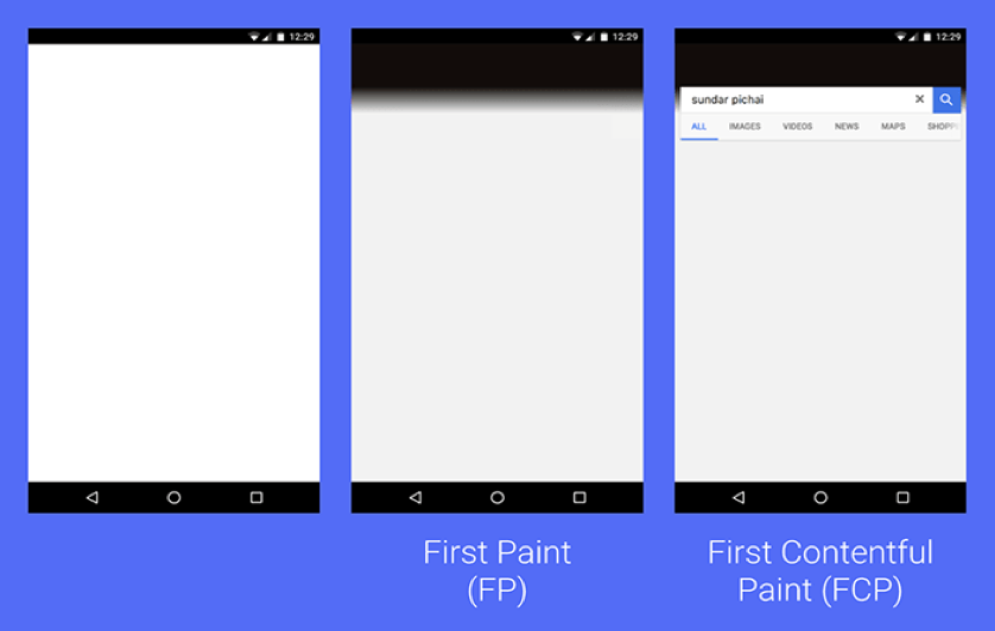
Image Source: newrelic.com
Therefore, always avoid multiple-page redirects as much as possible but note that they may be necessary for your site to work in some cases. So if you have to do redirects, follow the best practices such as combining multiple redirects into one, doing them on the server, shortening the redirect chain length, and regularly reviewing your redirects to remove those that you don’t need.
To avoid multiple page redirects, point the flagged resources directly to the final destination. And if a resource is part of your web page’s Critical Rendering Path, you should eliminate any redirects from it altogether.
5. Minify HTML/CSS/Javascript
You should minify and combine code files to optimize your website’s CSS, JavaScript, and HTML files.
Minification removes unnecessary things such as comments, whitespace, and unnecessary line breaks. The browser doesn’t need these pieces of information to render the page.
Conversely, the number of code files reduces when combined, increasing the FCP because fewer files make it easier for the browser to find and download them.
Also, minifying a website’s resources is a simple idea that can significantly improve its performance. Many hosting companies offer minification and compression services. So check with your provider to know what they offer.
6. Optimize Images
Images may not be the first thing to paint on a page, but significantly lowering the file size of images can possibly improve your FCP score. The large image files take time to load, thus, causing poor FCP scores.
While image formats like JPG, PNG, and JPEG are the most commonly used image files, swapping these with Webp or SVG formats will greatly impact loading time. SVG (Scalable Vector Graphics) and WebP have smaller file sizes specially developed for websites. These formats can scale to any size without losing quality.

Image Source: screpy.com
Also, CSS and HTML allow you to inline images using SVG or Base64 formats. Inlining above-the-fold images makes the browser avoid extra HTTP requests to download them. Removing render-blocking resources above the fold improves the FCP of a web page.
Some of the above-the-fold images you can inline include:
- Logo
- Icons (search, social media, etc.)
- Banner image
- Background images
While this method will most likely affect your LCP (Largest Contentful Paint) more than FCP, a small SVG logo can certainly be the first thing your users see when they load your page.
7. Improve Font Load Time
Flash of Invisible Text (FOIT) is a common issue when working with custom fonts. FOIT occurs when the browser cannot download a font file quickly. When this happens, the browser won’t show any text until the complete font file is loaded, exponentially increasing the FCP time.
The simplest solution is temporarily displaying a system font while the custom fonts load.
Adding the font-display: swap property to your @font-face style can help you achieve this effect. This property instructs the browser to use the fallback font until the custom font is ready.
If you are importing fonts directly from a CDN, for example, Google Fonts, you can achieve the same by adding the &display=swap parameter to the end of the URL.
Conclusion on First Contentful Paint

Image Source: onely.com
FCP has become part of Google’s search algorithm, and web owners should track this key metric closely. Besides the three Core Web Vital metrics, Cumulative Layout Shift, Large Contentful Paint, and First Input Delay, a fast FCP improves your PageSpeed score and leads to a better user experience.
In this article, we’ve learned how to optimize FCP using several techniques. However, sometimes it might be overwhelming to grasp and nail down the technical jargon. Luckily, a great performing plugin such as WP Rocket and a fast hosting provider can help you improve your FCP score.
