We have all encountered TBT in our internet escapades. And no, I do not mean Throwback Thursdays. I mean, when you have entered a search item on your engine of choice, it takes a long time to see anything on the page. You are left wondering what went wrong, is it your internet connection, or perhaps too many tasks are running in the background?
Well, whichever the case, you are better off being acquainted with Total Blocking Time.
What is Total Blocking Time?
Total Blocking Time, similarly contracted as TBT, is a Lighthouse Performance score that measures how long a page takes before it becomes interactive to the user. In simpler terms, it measures the period that the page was blocked from you.
What happens in between is what is called a long task. Long tasks are processes that run on the main thread timeline for longer than 50 milliseconds (ms). An important factor to note is that the browser cannot interrupt a task that has already started, including long main thread tasks. At this time, these long tasks block the main thread.
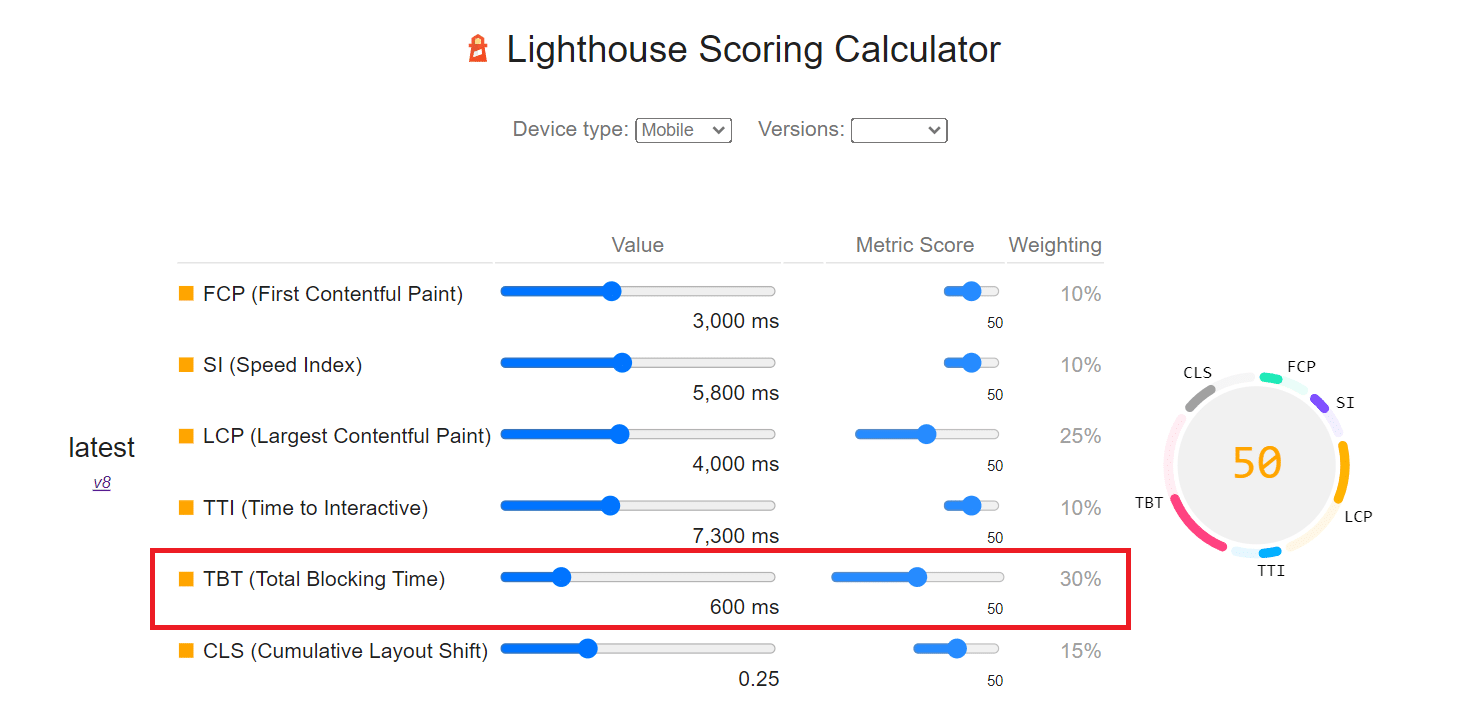
Image Credits: wp.rocket.me
So you can imagine that the browser will have to wait for the specific long task to complete before being interactive to the user. Interactions with the browser, such as keyboard presses, mouse clicks, screen taps, and other important tasks, will not be responded to until the long task completes. To surmise this, TBT will prevent input responsiveness and the page’s interactivity.
What is a Long Task?
To better understand long tasks and what TBT is, consider the following example:
There are three tasks; 90 ms, 250 ms, and 40 ms. Remember, a long task takes more than 50 ms. The first and second tasks will be long tasks as they take more than 50 ms to complete. The last task, however, is not a long task as it takes less than 50 ms.
All the time spent after the first 50 ms is called blocking time. So for the first task, the blocking time is (90-50 ms) 40 ms, while for the second is 200 ms. Consequently, to calculate the Total Blocking Time, we add all the blocking times. In this case, 40 + 200 ms = 240 ms.

Image Credits: web.dev
In the above example, we have three tasks with a Total Blocking Time of 240 ms. If we had one task that takes 600 ms, in this case, the TBT is 550 ms, which is more than that of the previous three tasks combined. What this shows is that:
- Small tasks do not automatically mean low TBT
- Large tasks do not automatically mean high TBT
TBT, TTI, and FCP
TTI, TBT, and FCP are key metrics in assessing your page’s responsiveness to user input. TTI, standing for Time To Interactive, is an important metric that measures the exact time when the last long task is completed.
This means that the main thread can now respond to user interactions. A good TTI is anything less than 5 seconds. Generally, TTI is how long a page takes to be fully interactive.
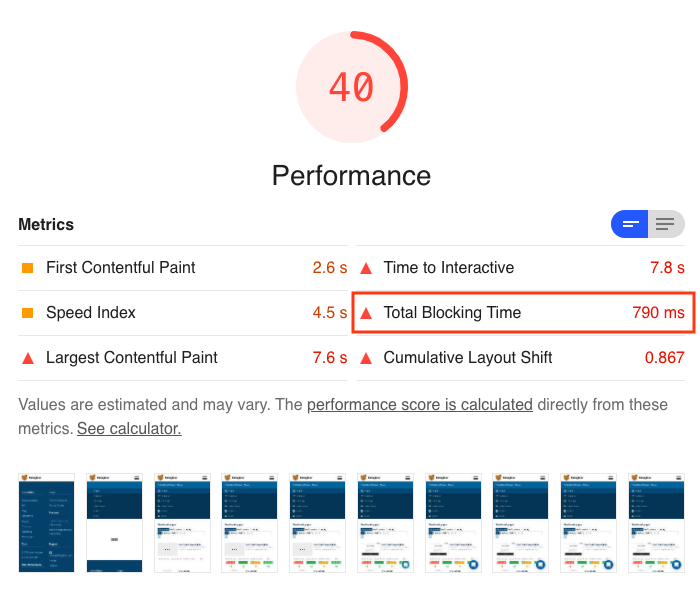
Image Credits: isotropic.com
FCP stands for First Contentful Paint and is a speed ranking performance metric that measures how fast a page loads. This means the user should see either text or image on the screen. The faster the FCP, the more assured a user is that something is happening on the page.
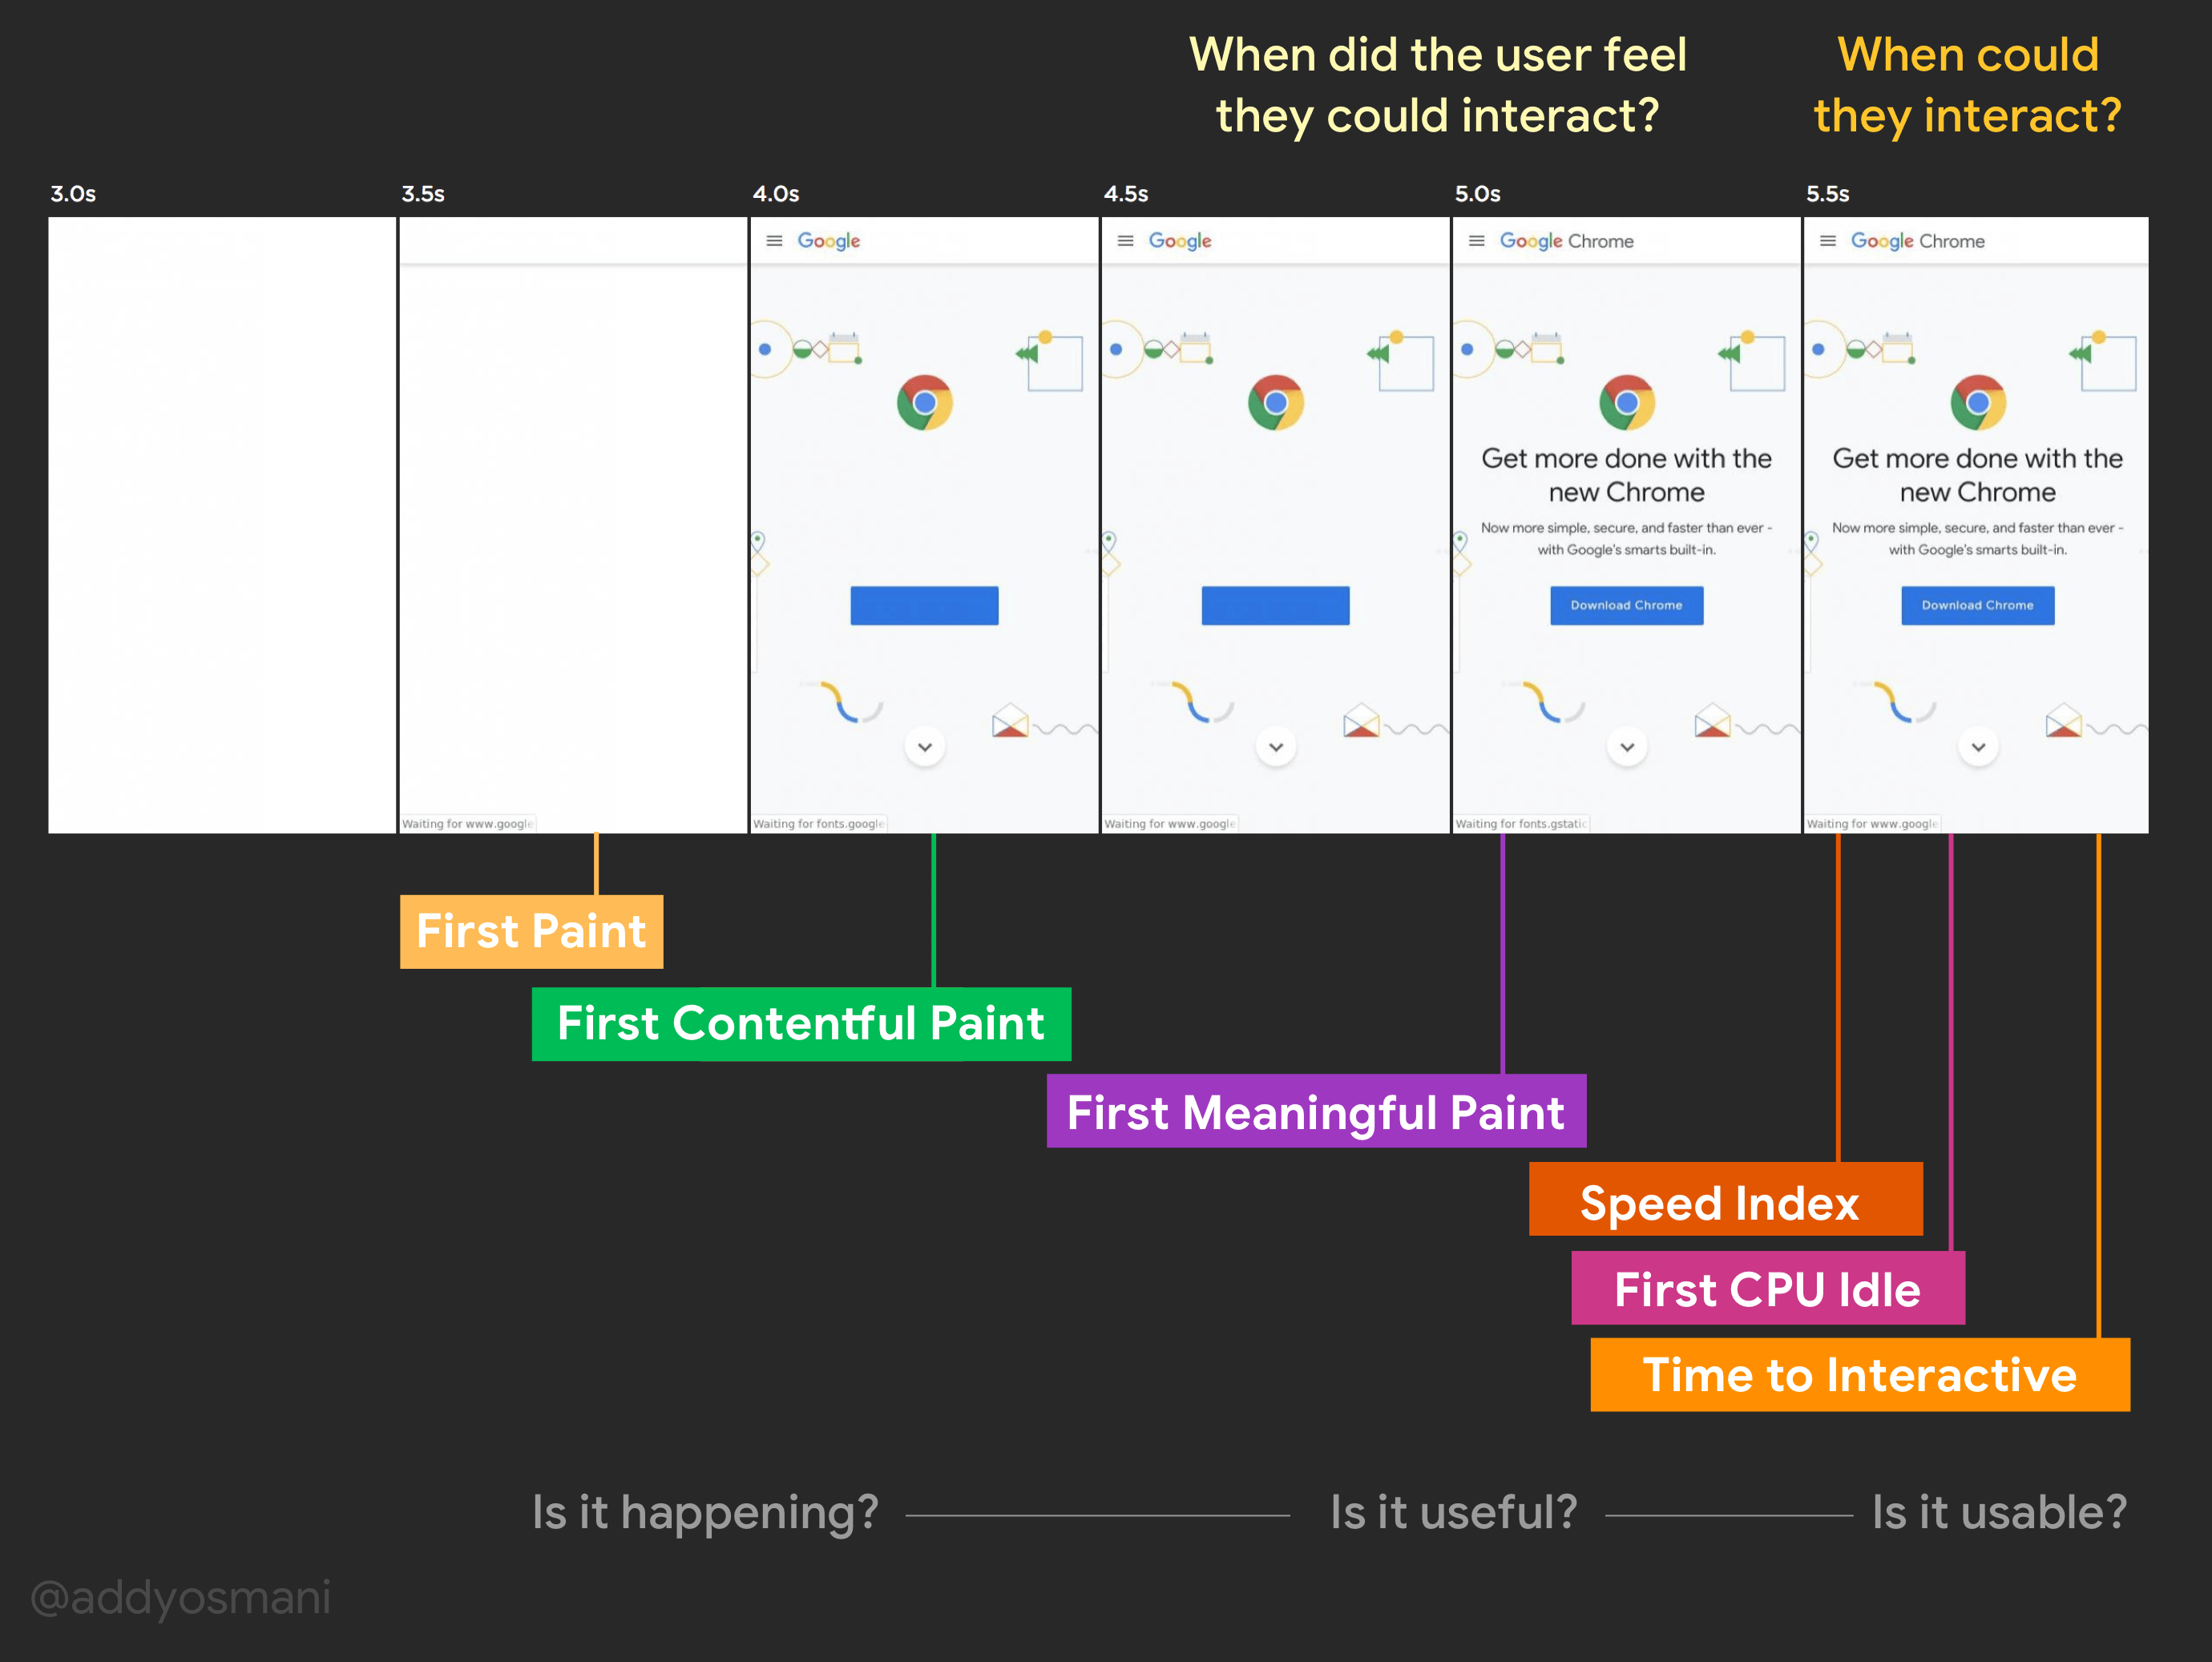
Image Credits: addyosmani.com
FCP differs from LCP (Largest Contentful Paint) in that the latter measures when the page’s main contents have finished loading. To understand the difference, remember the last time you Googled something, and the page took too long to load?
Well, the first empty page means that FCP has not yet happened. The moment the first content shows, whether it’s the search button or the output you wanted, is when FCP happens.
Quick Tip: TBT measures how long a process or system waits for resources to become available.
How Is TBT Measured?
It is very important to measure Total Blocking Time because the user perceives your web page as slow if the TBT score is high. If the page loads slowly after user interaction, it is bad for business.
Optimally, TBT varies on the device from which the content is viewed. For mobile devices, the ideal TBT should be below 300ms; for desktops, a good TBT score should be below 100ms.
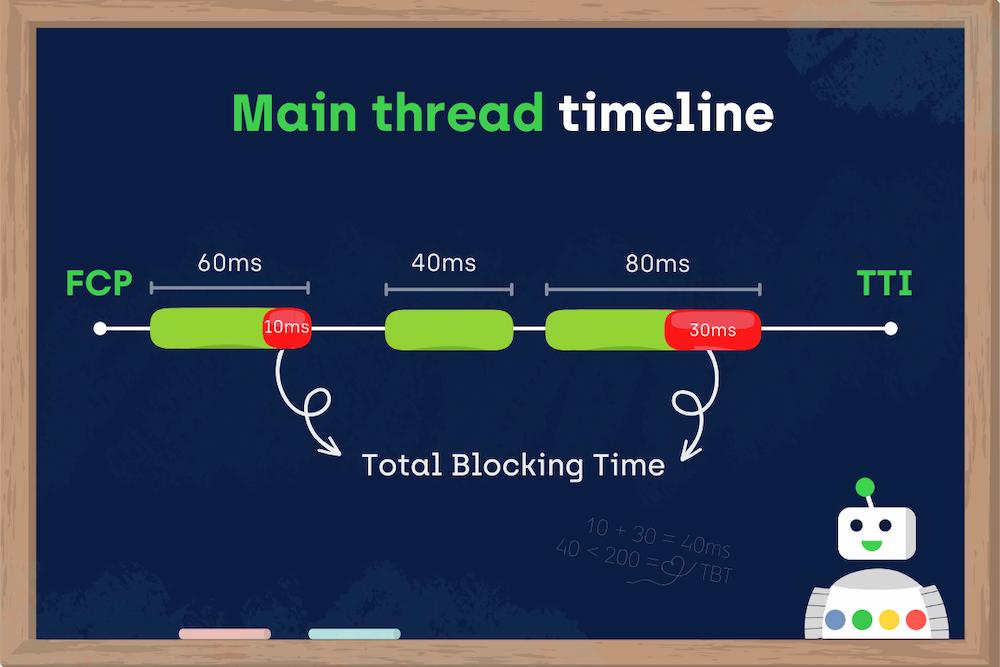
Image Credits: onely.com
Thus the need to have systems in place that measure your site’s performance. The following are some of the strategies used:
Performance Monitoring Tools
Tools such as Google Lighthouse, WebPageTest, and Chrome DevTools can be used to monitor your site’s performance.
1. Google Lighthouse
The lighthouse report gives you an insight into your site’s Total Blocking Time, SEO performance, and accessibility. You basically give Lighthouse a URL to audit, and it returns the report to you on how well the page did (or otherwise).
The Lighthouse performance score relies on the TBT score at 30%. This is almost a third of the whole score.

Image Credits: chromedevelopers.com
It can be used as a browser extension, integrated into your code’s build process, or run in the command line. The following are ways to achieve this:
- Using the Lighthouse tab from Chrome DevTools.
- Run the Node command line tool.
- Run Lighthouse on PageSpeed Insights.
- Lighthouse as a Chrome extension.
2. WebPageTest
This is a free tool that measures web vitals, such as TBT. Once you visit their website, enter the specific URL you wish to test, then select the test configuration you want and start the test. After a few minutes, you will get the performance score alongside a detailed analysis of your site’s vitals.
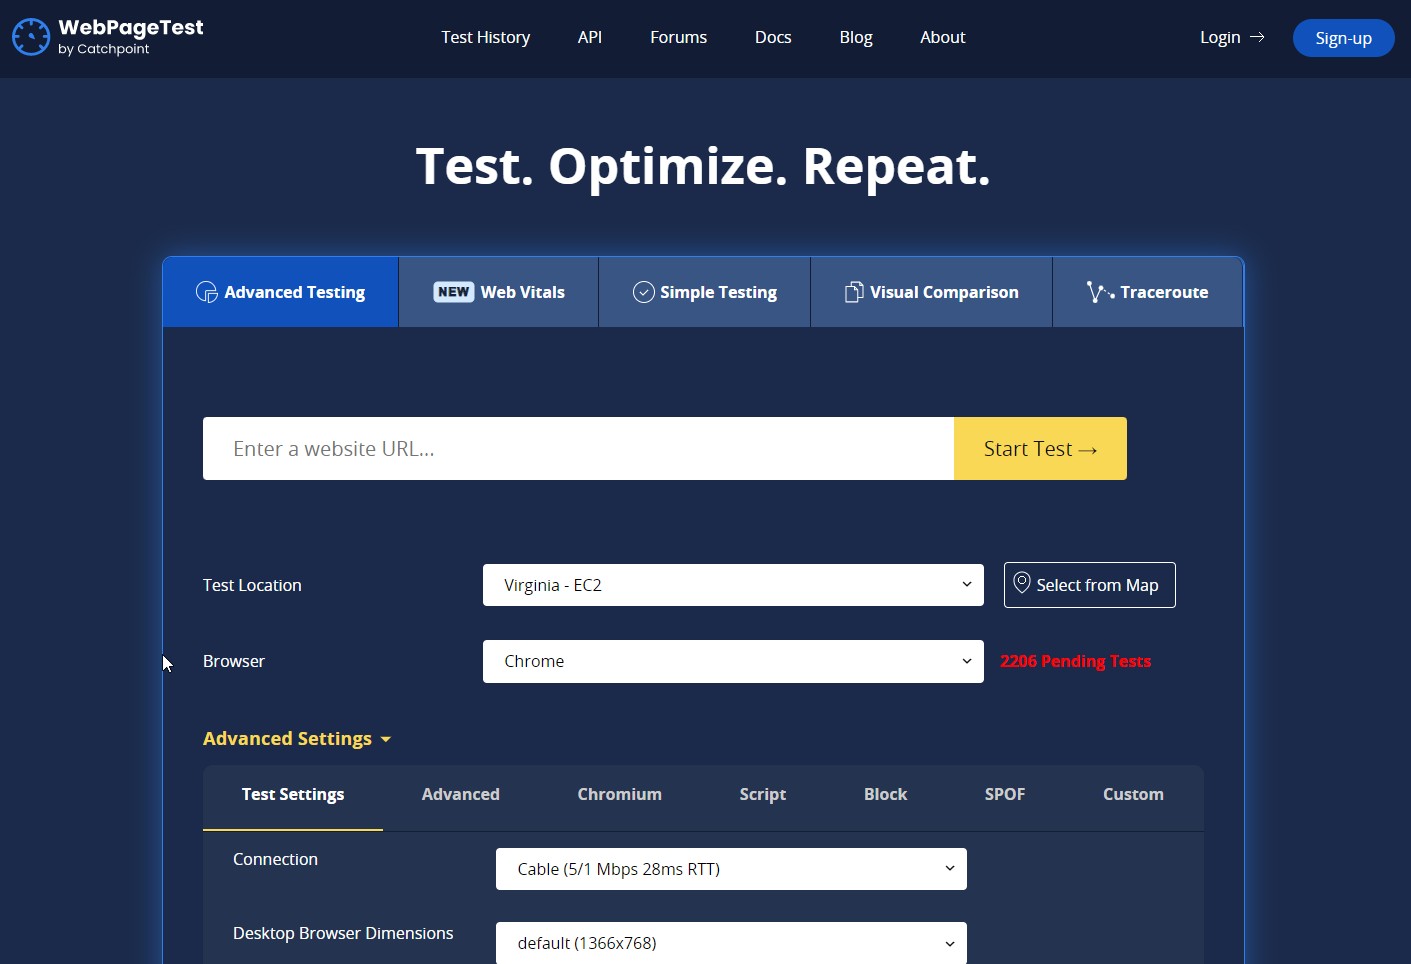
Image Credits: methodsandtools.com
The site also calculates how much time each script takes to execute, that is, each script’s CPU time. By having this information, you can tell which tasks take longer than others and if it is possible to delegate them to a later time, just after the main page has loaded.
3. Chrome DevTools
You can access a recording of how your CPU is being used and identify tasks taking too much time. This tool lets you know how much of your time is being used to cater for long tasks in an alarming red color that will jolt you to act immediately.

Image Credits: chromedevelopers.com
How to Improve Total Blocking Time (TBT)
The best and most effective way to improve your site’s TBT score is to identify the issues that cause long tasks to build up on your site and work to reduce their effect. The following are some of the reasons why long tasks happen:
1. Ineffective Javascript Statements
There are some Javascript commands that return numerous nodes, more than are required. This means that a lot of resources were expended on unnecessary excesses. Instead, these commands can be refactored to only return what is required and eliminate the waste.

Image Credits: onely.com
Moreover, unoptimized content contained in these lines of code may reduce performance. Third-party scripts that are too long may also contribute to the long tasks on your site. One way to work around this is to load these scripts after the initial page load.
2. Javascript Files with Unused Code
These are Javascript files that do more than the main thread’s work. In this case, the file may be loading content that’s unnecessary for the main thread to load the page. A way to deal with this while improving your TBT score is by code splitting and removing all unused Javascript code.
Remember, even unused code has to be loaded, parsed, and executed by the main thread, meaning time and resources are wasted that could have otherwise been used to deal with the next important task.
What Is Code Splitting?
Code splitting helps to break down Javascript code into multiple chunks that can be loaded and compiled at different times. So instead of having long-running tasks, you can spread them over a specific time. By doing so, as well, you can only load the most essential files first.

Image Credits: next.js
How Do You Remove Unused Code?
There are several ways to remove unused code from your bundle. The first and often key strategy is to check for all unused libraries. It’s always time-saving, convenient, and reliable to include many libraries in your code, as they will step in when required without having you think up a storm over what’s needed for that particular line of code.
Granted, but sometimes we end up having unused libraries in the process. Libraries run by the main thread and ultimately end up as long tasks. So instead of having two lines of code calling the same library (with very few differences), delete one, and remain with the more-encompassing one.
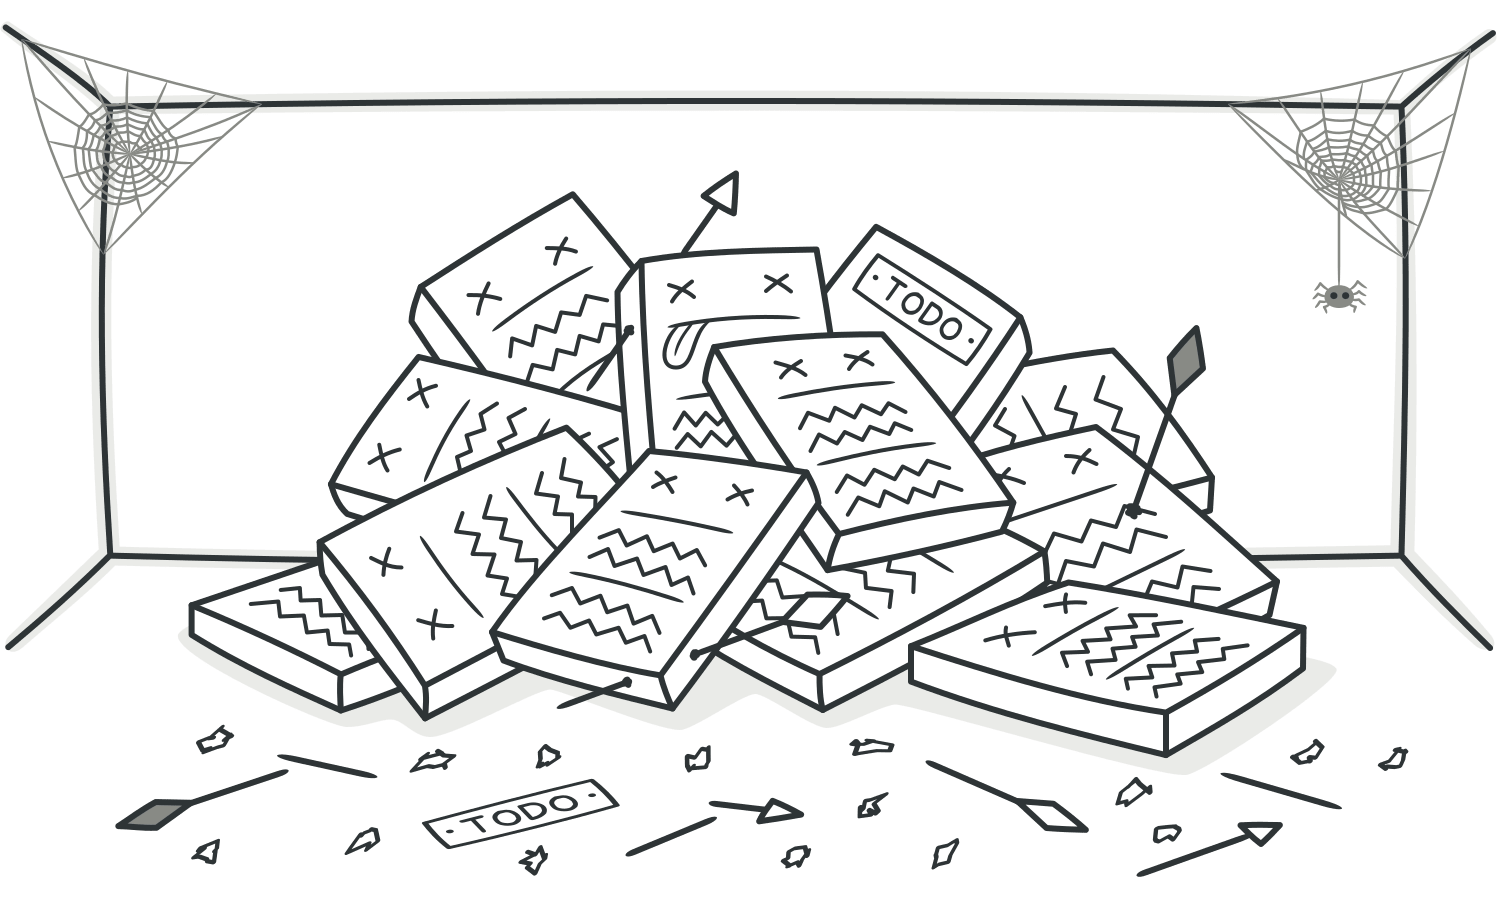
Image Credits: refactoring.guru
You can download plugins such as Webpack Bundle Analyzer to assist you in checking for unused code. It analyzes everything that makes up your bundle giving you a chance to detect any line of code that is unnecessary.
Another way to remove unused code is by identifying the specific instances in lines of code that are unused, in this case, extra spaces and newlines. These unnecessary characters may result in your page loading slower.
The following are some suggestions to deal with unused libraries and code in your project:
- If a library isn’t being used, remove it entirely.
- If the initial page load can happen without the library, remove it as well.
- If the library can be broken into parts and imported selectively (depending on its intended task), then use the library’s section that is useful.
Another way to view the issue of improving your page’s TBT score is from the perspective of optimizing your main thread’s processes. You may also consider using web workers to further minimize main thread work.
How TBT Affects SEO
Search Engine Optimization (SEO) is interested in ensuring your site is made better for search engines. It means more visibility for your site in search results, implying that users will find it easier and faster. In a direct way, therefore, TBT affects your site’s SEO metrics.
In 2021, Google announced a very important metric to start implementing on its pages: Core Web Vitals. This metric is dedicated to how users interact with your page, that is, page experience.
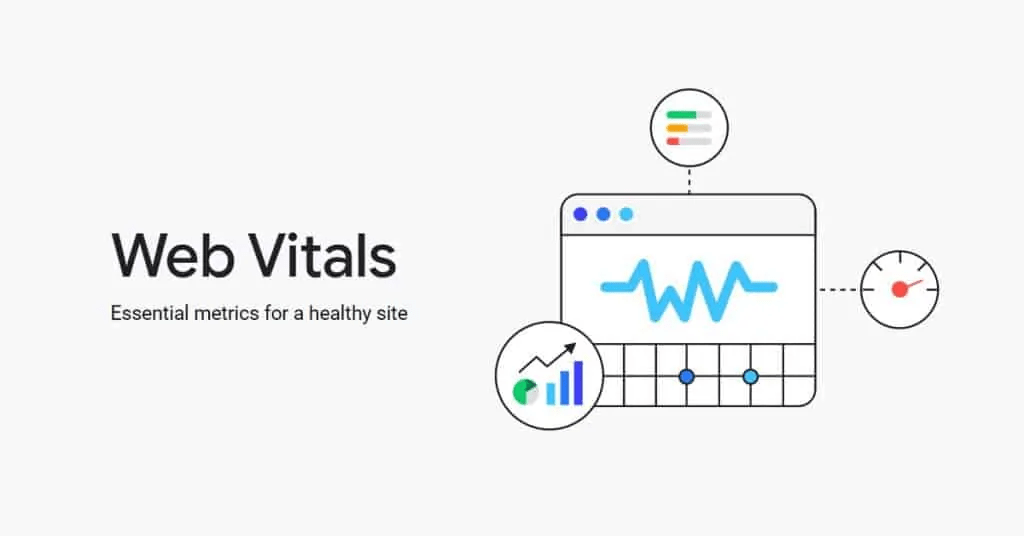
Image Credits: gorilladesk.com
More specifically, Google centered on three key aspects of your web page:
- Loading: How fast does content appear on your screen?
- Interactivity: How fast does your page react to user input?
- Visual Stability: During the loading process, does stuff move around the screen?
Now, to measure these aspects, Google uses the following metrics:
- Largest Contentful Paint (LCP) – must be below 2.5 seconds (for most optimized content)
- First Input Delay (FID) – must be below 100 ms
- Cumulative Layout Shift (CLS) – must be below 0.1
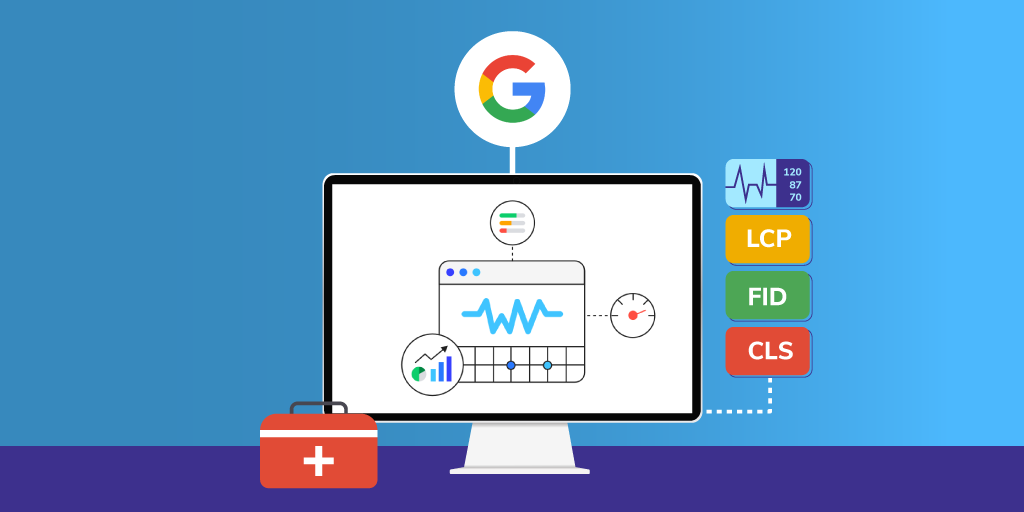
Image Credits: bounteous.com
Google’s Core Web Vitals metrics also consider Total Blocking Time as it affects your site’s interactivity and loading time. User interaction is a key aspect of SEO, as users may become frustrated if a site loads slowly and may ultimately leave the site if no content is displayed within the shortest time possible.
This is called bounce rate. It is the percentage of users who visit a page and leave without interacting with it. Imagine if your site is an eCommerce site, and you need customers to make purchases after or while interacting with your content.
Unfortunately, due to long blocking times, they leave the site without even seeing your product in the first place. How devastating and wasteful is that?
Image Credits: agencyanalytics.com
If you have 1000 visitors to your page daily and 100 visits only the first page, and even then, they leave immediately, you have a bounce rate of 10%. This number changes often, so analyzing your site’s bounce rate is key in identifying how to improve your TBT score and web page’s SEO score.
The optimal bounce rate is somewhere between 26% and 40%. Mobile phones have a higher bounce rate than desktop sites, at 51% compared to 43%, so while assessing your site’s bounce rate, consider where most of your users were interacting with it from.
Google uses Mobile-First Indexing, which indexes and ranks depending on the website’s mobile version. This means that to improve your SEO score, you should take into serious account the Total Blocking Time in mobile phone devices, seeing as they may suffer from low connectivity issues and less power in terms of CPU.
Key Takeaways
Consider this your cheat sheet for anything TBT. We summarise some of the most important details about TBT in the following points:
- TBT measures how long the main thread timeline is blocked and should be minimized as much as possible.
- Google uses the Total Blocking Time metric in its user experience metrics, Core Web Vitals.
- TBT affects SEO in terms of page speed or user experience.
- Faster TBT partially contributes to higher search rankings.
While TBT may be an important metric in measuring SEO rankings, it is not the only metric tracked to measure a website’s responsiveness and overall performance score.
